Element5 expands mass timber production in Ontario
Element5 is investing $107 million to expand its mass timber operations in St. Thomas, Ontario.
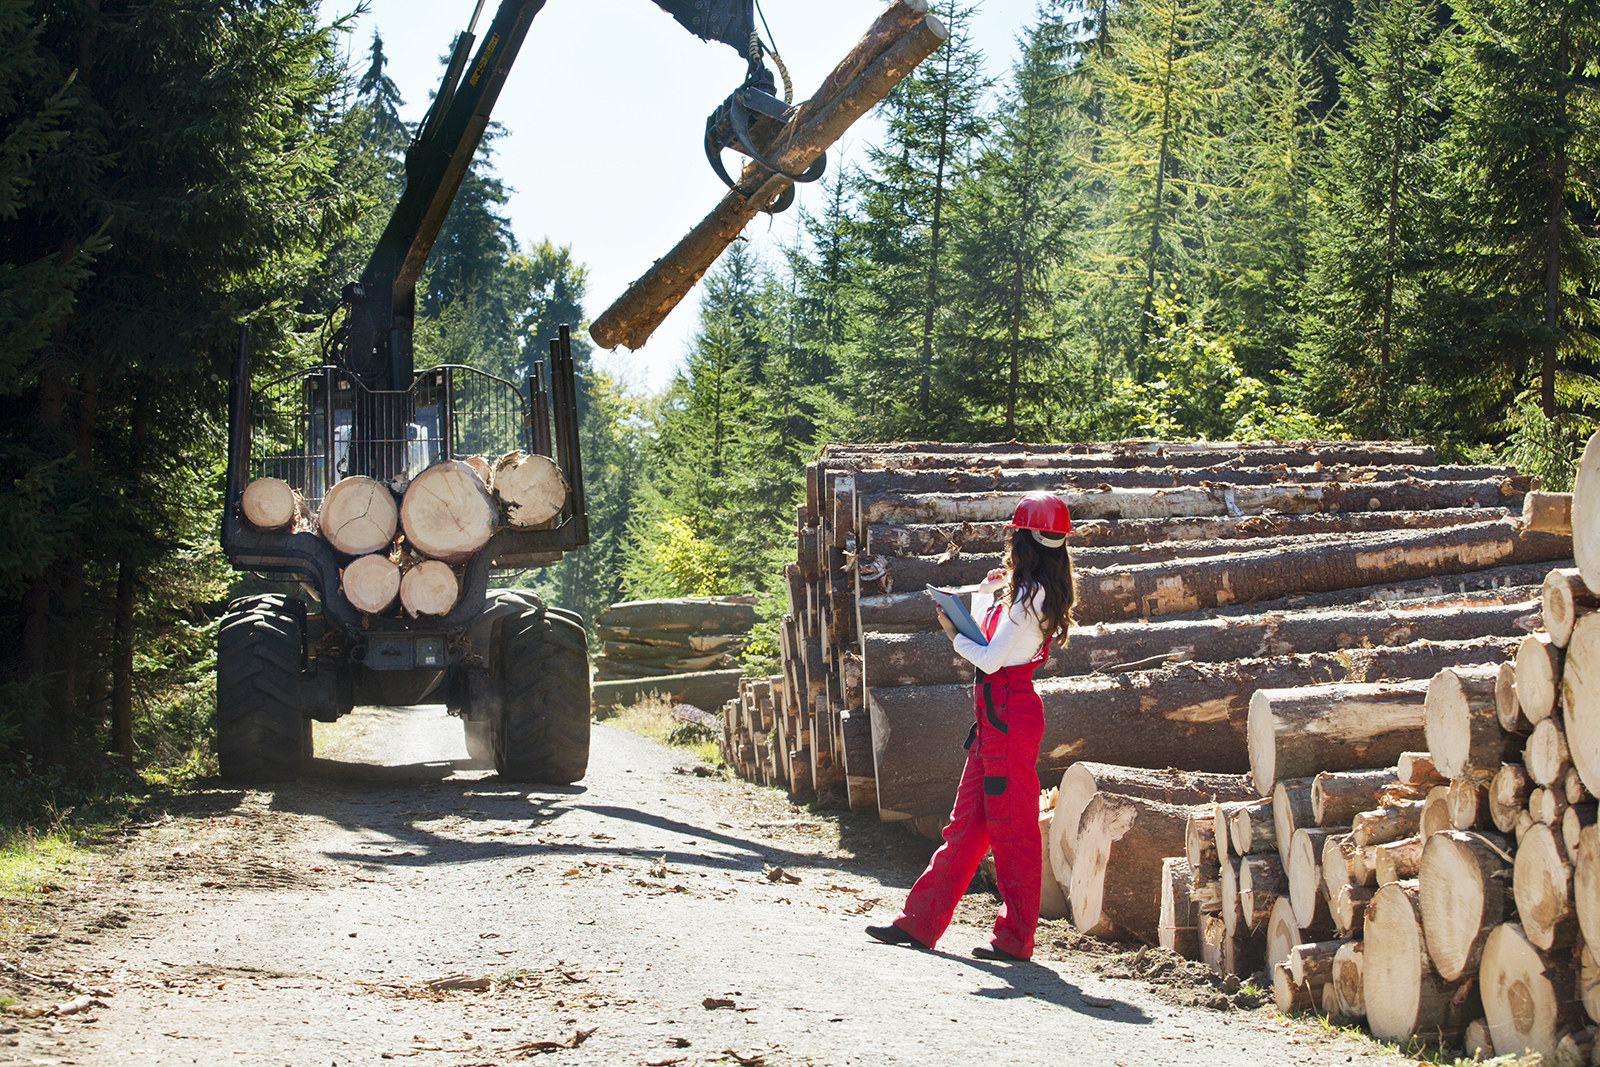
Explore Ontario’s forestry sector, where economic prosperity intersects with environmental stewardship. With forests covering 66% of the province's land area, Ontario’s forestry industry is not only a significant contributor to the economy but also plays a crucial role in maintaining ecological balance.
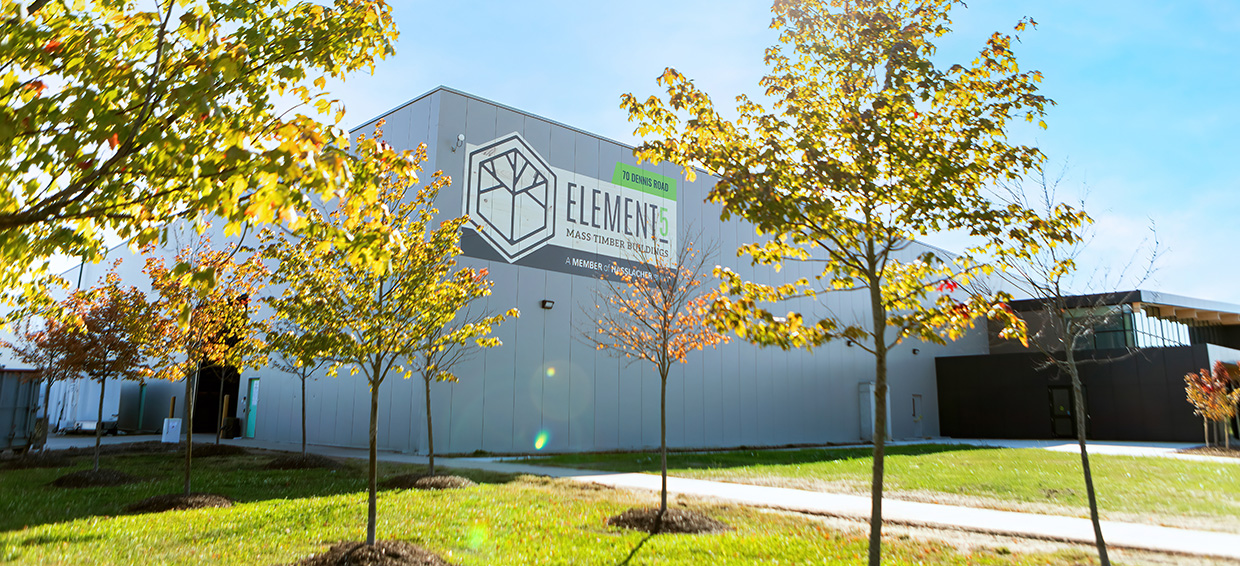
Element5 is investing $107 million to expand its mass timber operations in St. Thomas, Ontario.